The
June 2002 Traffic Study
Source Data: Delaware Valley Regional
Planning Commission (DVRPC) ~ Philadelphia, PA
How To Interpret This Map
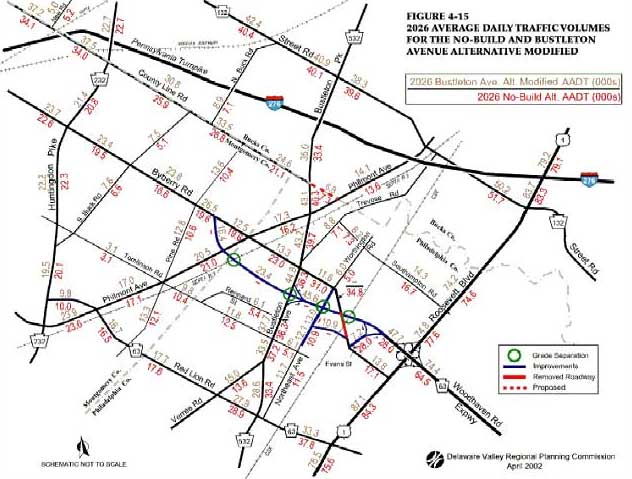
- This traffic study was conducted by the Delaware Valley Regional Planning Commission. It documents the forecasted traffic volumes that will be growing in the project area by the year 2026.
- The ttan numbers represent traffic volumes in a build alternative that includes the construction of the extension.
- The red numbers represent traffic volumes in a no-build alternative that does not include the construction of the extension.
- The decimal point in each number represents a comma. For example, a number that reads as 45.6 = 45,600
- That means on a daily basis, there will be 45,600 vehicles driving on the roadway.
- As one can see, the tan numbers are higher than the red numbers.
In
this Build Alternative, Traffic Volumes will be Decreased on Roads in the Eastern
Portion of the Project Area
but Increased in the Middle and Western Portions
but Increased in the Middle and Western Portions
- Locate Byberry Rd. and read the numbers that are above and below the black line.
- Notice how the tan numbers (above the line) are lower on the portion of Byberry Rd. near the right side of the map (which is the Eastern portion of the project area.)
- The reason the numbers are lower on this portion of Byberry Rd. is because the new extension would be built 1/4 mi. south of Byberry Rd. to prevent the new expressway traffic from accessing that portion of Byberry Rd. by transferring it to other neighborhood roads.
- Notice how the tan numbers are higher as you move away from the eastern portion of the project area.
- This indicates that traffic volumes will increase throughout the majority of the project area due to the presence of the new roadway which is linked to the Rt. 63 Woodhaven Expressway - and funneling that traffic into the project area. This illustrates the concept of induced traffic.
This can result in drivers making longer trips or making short trips more often than they did before.
Several types of changes to travel patterns may occur after a new roadway has been built. These can include drivers changing their choice of route. For example, regular journeys involving same origin and destination made quicker by using the new road.
Very quickly induced traffic causes the new road to become congested. The rate of increase only slows down once congestion becomes as bad as it was before.